Latitude vs X.
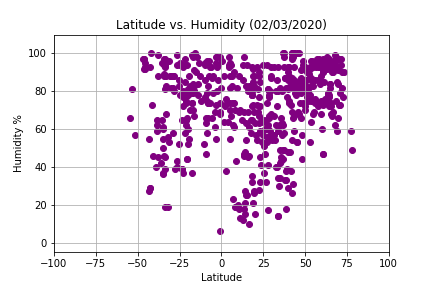
The purpose of the weather study was to analyze a list of random cities to see if the weather got warmer if they were closer to the equator. The Python Numpy library was used to create random combinations of latitude and longitude coordinates which were stored in a Python list. Next the Citipy module was imported to generate the nearest city for all 551 latitude/longitude coordinates and these were stored in a list as well. Finally, API calls were made to the openweathermap.org API to gather weather data for each city which was stored into a final Python Pandas dataframe. The data was then used to create four weather visualizations using Python's Matplotlib module. All visualizations compare a weather element and its relationship to each cities' location of latitude.
Visualizations